The way usage is currently presented is misleading.
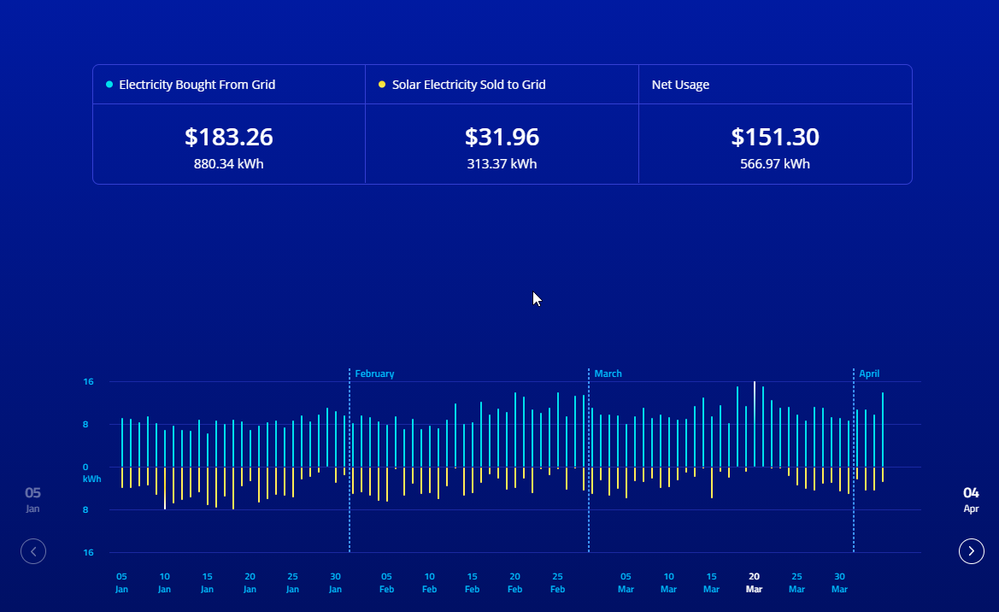
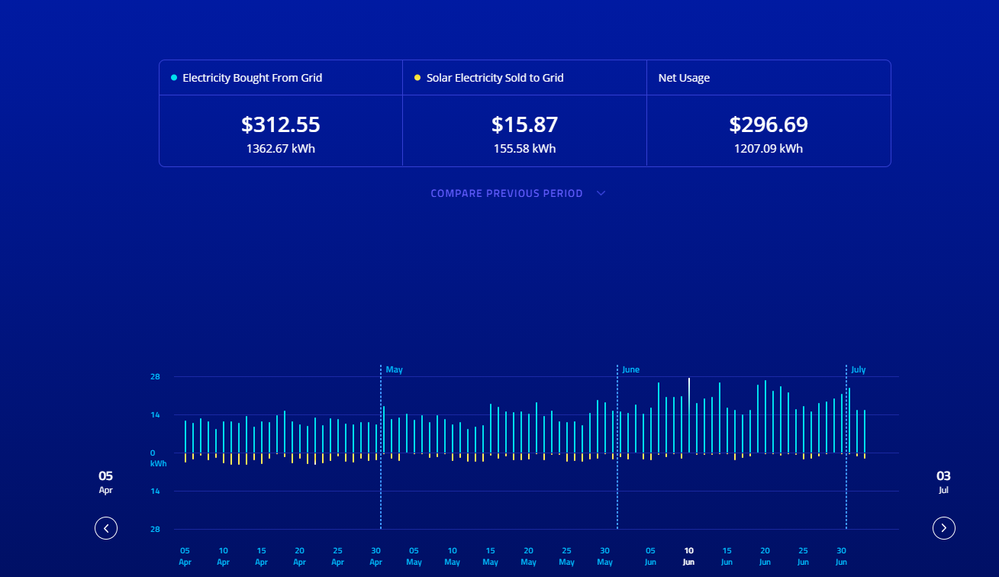
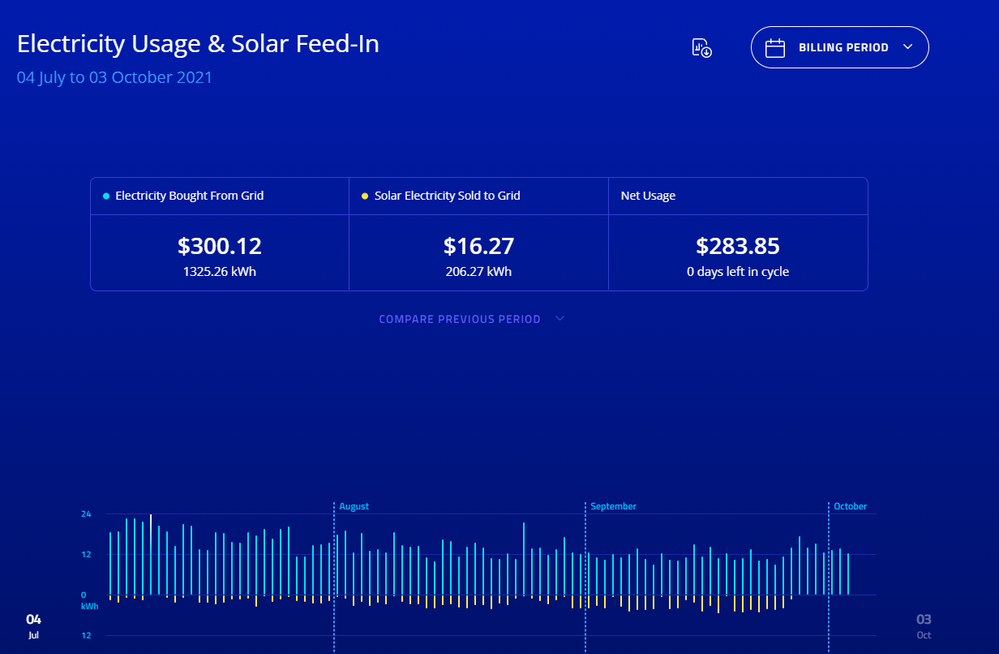
The graph for each quarter is drawn on a different scale, so it is tricky comparing quarters
For example
December, January February has a maximum of 16 kWh
April, May, June is 28 kWh
July, Aug Sept is 24 kWh