- Neighbourhood
- >
- Energy
- >
- Energy Accounts & Plans
- >
- AGL app and actual usage and feed in mismatch
Energy Accounts & Plans
Questions and discussion about AGL's Energy plans and your AGL Energy account
- Subscribe to RSS Feed
- Mark Topic as New
- Mark Topic as Read
- Float this Topic for Current User
- Bookmark
- Subscribe
- Mute
- Printer Friendly Page
AGL app and actual usage and feed in mismatch
- Mark as New
- Bookmark
- Subscribe
- Mute
- Subscribe to RSS Feed
- Permalink
- Report abuse
Ok, I have just switched over to AGL. Hopefully I don't regret it. My issue is that the app is showing completely different data than what it actually is..
Let's use the 3rd of June, first day of data display on the app.
Inverter generation 13.1 KWh
AGL June 3rd data
Electricity bought from grid 21.50 KWh
Solar electricity sold to grid 3.20KWh
Net usage 18.30 KWh
Previous Retailers June 3rd data
Electricity bought from grid 7.83 KWh
Solar electricity sold to grid 10.11 KWh
Powerpal app attached to smart meter says I used a total of 7.83 KWh on June 3rd.
Judging by these figures, it sounds like the 3KWh that I supposedly fed in to the grid is the power I used for my house load before feed in, and I am getting charged for what was actually fed in ie. The 10.1 KWh. And the 7.83 KWh actually used.
So what I actually used plus what was actually fed into the grid AGL claims is my usage. It almost adds up.
Spoke to an AGL rep today and was told to wait a couple of days as they don't have the data yet because it is so soon after the account transfer. How then could I have the data on the app.
I was told it may be incorrect.
Any answers would be appreciated and if someone else had this problem, was it resolved?.
Thanks.
Solved Go to Answer
- Mark as New
- Bookmark
- Subscribe
- Mute
- Subscribe to RSS Feed
- Permalink
- Report abuse
- Mark as New
- Bookmark
- Subscribe
- Mute
- Subscribe to RSS Feed
- Permalink
- Report abuse
I have had solar for many years, all with AGL. I have noticed Credits steadily decline - for the first maybe 7 years I was always in credit (as high at $500+ per quarter. Now (esp. since going to monthly) credits are proportionally lower, even in matching periods ... My real concern is: my inverter in the last few months reports from 15kwh to 20kwh per day generated, but in the last few bills only show a feed-in of average 10kwh per day? Why this discrepancy?
- Mark as New
- Bookmark
- Subscribe
- Mute
- Subscribe to RSS Feed
- Permalink
- Report abuse
- Mark as New
- Bookmark
- Subscribe
- Mute
- Subscribe to RSS Feed
- Permalink
- Report abuse
@Strega @Binoj_Mathew @Spectral @Jack17
Hi all,
Now solar is dependent on having the sun to illuminate the panels.
For instance +++++++++++
Let's use the 3rd of June, first day of data display on the app.
Inverter generation 13.1 KWh
AGL June 3rd data
Electricity bought from grid 21.50 KWh
Solar electricity sold to grid 3.20KWh
Net usage 18.30 KWh
++++++++++++++++++++++++
Now I read this as.
On the 3rd of June you generated a TOTAL of 13.1kWh
You purchased 21.5 kWh
Getting a payment for 3.20kWh
So on that day you consumed ((21.5+13.1) - 3.2) or 31.4 kw....
I don't see how you can use data from a previous year as a comparison.....
Now each day with solar you need to take into consideration all of figures.
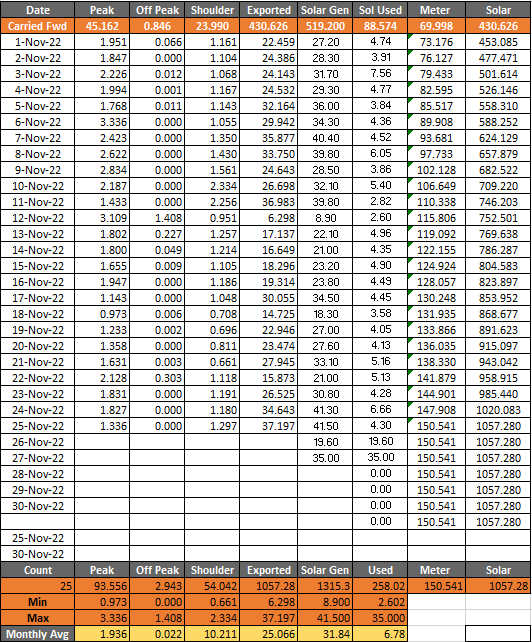
I keep a spread sheet for my data
Above is my data for the 3rd and 4th June this year.
On the 3rd I used 7kW and exported 6kW, the 4th 6.2kW and exported 13.4kW.
My Peak consumption for the two days is similar as is the amount I self consumed.
On the 3rd I only generated 9.3 and exported 6 but on the 4th I generated 16.6 and exported 13.4.
Now my figures are based on actual data and I can show them since I had the solar installed.
Now I can see a pattern there, my used (Solar) is roughly the same.
The increased peak is due to the fact that we consumed more from the grid during the non solar hours.
Higher used (solar) is normally because the output from the solar panels was down whilst we were heating our hot water using the heat pump system or it may have been that it was colder in the morning and we consumed more hot water than normal.
So my answer to your questions is that everything is relative and you need to look at the facts based on known data.
Hope this helps.
Cheers Neil
If you like my reply please take the time to click on the like button to show your appreciation of someone's response.
If this comment solves your issue please solve the post, if you like this comment please take the opportunity to click the Like button below.
- Mark as New
- Bookmark
- Subscribe
- Mute
- Subscribe to RSS Feed
- Permalink
- Report abuse
Hi Neil,
Please find the data, are you seeing a discrepancy here?
Inverter generation 90.30 KWh on 21-Nov-22
AGL 21-Nov-22 data from the app
Electricity bought from the grid 7.54 KWh
Solar electricity sold to grid 13.80KWh
My daily average usage as per AGL is around 18 KWh per day.
- Mark as New
- Bookmark
- Subscribe
- Mute
- Subscribe to RSS Feed
- Permalink
- Report abuse
Please supply data for the last month.
To have 90kW I would assume you have three phase.
So 90kW is your average, 18kW is your average usage.
Your average feed in is therefore 72kW a day then ???.
Cheers
Neil
If this comment solves your issue please solve the post, if you like this comment please take the opportunity to click the Like button below.
- Mark as New
- Bookmark
- Subscribe
- Mute
- Subscribe to RSS Feed
- Permalink
- Report abuse
- Mark as New
- Bookmark
- Subscribe
- Mute
- Subscribe to RSS Feed
- Permalink
- Report abuse
The formula is very simple
Solar Generated - Solar Exported = Solar Used
Now I run two programs to convert the data from the AGL downloaded file into usable data.
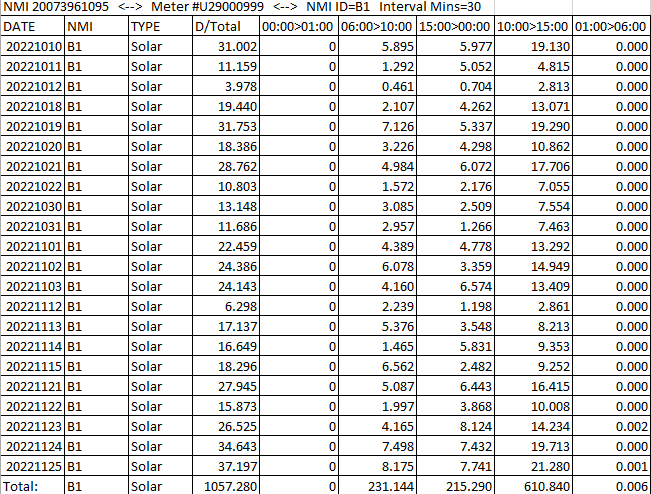
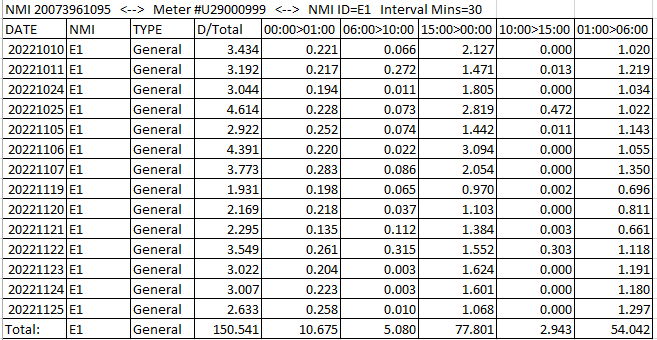
From running it just now, the initial screen report shows
However the process is much more complicated and in fact can create automatic user configurable reports.
I am on TOU (Time Of Use) which means I am charged different rates for different times of the day.
Above is cut down version of the reports produced (I have a controlled load meter but this is not in use at the moment)
I then convert this data into even more usable format and put that into my ElectUsed spread sheet.
So I can see exactly what is occurring with my electricity.
Now unfortunately, AGL does not do the correct calculations when showing your usage and only gives a general estimate of your usage and is not converted into the correct times in most cases.
The real information is only shown on your final bill unless you take the time to decode the information supplied in the Download file, which I do.
Unlike the people in this thread I have the data and have never had to query AGL on any data and further more can do prediction of what my final bill will be.
So here is my final bill prediction after 47 days into my bill which allows me work out my fortnightly payment (if required) to AGL.
Anyway until you collect all the data and then analyze it, you can speculate about any one day as much as you like.
If you like, you can Private Message me and you can then send me a copy of your download file and I can analyze it for you and convert it into a NEM format file.
Alternatively you can request AGL to send you a NEM format file (takes up to two weeks) so you can do your own reports from that.
By the way, with my solar, I can only generate a maximum of about 40kW a day due to the layout of my roof and the position of a large gum tree. We have had a large number of days that are overcast and raining which is limiting the solar produced this year.
Cheers Neil.
If you you like my response (or anyone else's) please take the time to click on the like button on that reply to show your appreciation. It takes time for people to reply to queries and without appreciation people will stop taking the time to answer.
If this comment solves your issue please solve the post, if you like this comment please take the opportunity to click the Like button below.


