- Neighbourhood
- >
- Energy
- >
- Managing Your Energy
- >
- Re: Merging AGL and Solis/Ginlong solar data
Managing Your Energy
Questions and discussions about managing your energy usage and saving money
- Subscribe to RSS Feed
- Mark Topic as New
- Mark Topic as Read
- Float this Topic for Current User
- Bookmark
- Subscribe
- Mute
- Printer Friendly Page
Merging AGL and Solis/Ginlong solar data
- Mark as New
- Bookmark
- Subscribe
- Mute
- Subscribe to RSS Feed
- Permalink
- Report abuse
Downloading spreadsheets from https://myaccount.agl.com.au/usage and https://m.ginlong.com ("Devices" tab, then click on your inverter), I have been able to produce graphs like this:
Where:
Grid = power I'm taking from the grid.
Solar = total power generated by my solar panels.
FeedIn = power fed back into the grid (from my panels)
Looking at the difference between "Solar" and "FeedIn", I can see our daily self-consumption.
I experimented with a few different ways to combine the data, but (so far anyway) I find this the most useful. If anyone can think of other useful ways to graph the data, I'd be interested to hear about it.
Solved Go to Answer
- Mark as New
- Bookmark
- Subscribe
- Mute
- Subscribe to RSS Feed
- Permalink
- Report abuse
Schander,
Your suggestions are good (and appreciated).
We are currently on the default fixed rate in Victoria (which, for now, I’m happy with). We are attempting to self-consume as much as we can.
To understand how successful we are and whether we would be better off under a different scheme, I need to understand our usage patterns. That is all I’m aiming for at this stage.
Once we have optimised our arrangements (and consumption habits) I plan go into the sort of financial analysis you are suggesting, to fully asses the effectiveness of our panels. (Although I can’t really tell the installers to come and collect them and give us our money back, if I don’t like what I find).
- Mark as New
- Bookmark
- Subscribe
- Mute
- Subscribe to RSS Feed
- Permalink
- Report abuse
Hi,
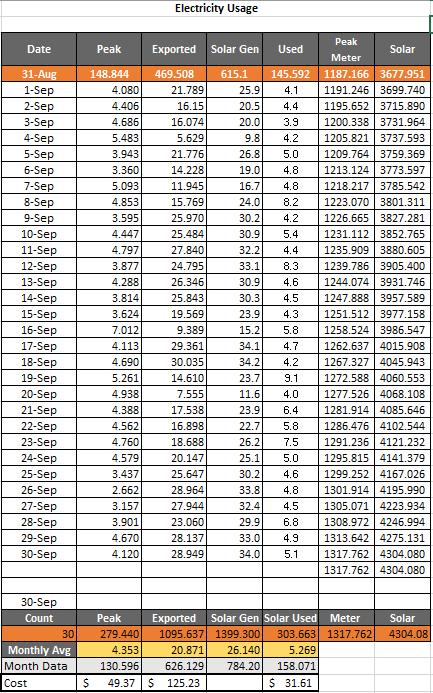
Here is a one month sample from my spread sheet
This is for Sept this year and is part of my current bill. The METER and SOLAR figures are the CURRENT Meter Readings.
Peak is the Month Total, then below the daily average, and then the Month Data
Same for Exported (exported to the grid)
Solar Generated I get from my Goodwe Inverter and Solar Used (Generated - Exported) is what I consumed in the house when I was generating.
So my cost for the month is $49.37 - $125.23 or -$75.87
In actual fact though (which I know I should add 30*$0.90 or $27.00 for the supply charge) which will make the value of -$48.86 for the month. (Yes AGL owes me $48.86 for this month).
What about the $31.61 you ask. That is an additional saving. If I did not have the solar panels my electricity for the month would have cost $48.86+$31.61 or $80.61
By the way I have electric hot water (a heat pump) that uses my Solar to run it ( about 3kw) high usage days are when my partner is home and cooks during the day.
I don't have controlled load in use so get supplied a 0 use per day value from the MyUsageData_....csv file using a small program (AGL2nem) which makes a NEM format file.
Which I then process into into readable daily data using another file.
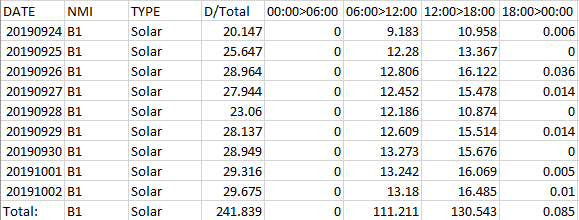
Here is a sample from my solar meter from running MeterRead program (you can have up to 10 report line besides the D/Total)
The info is supplied in a CSV file so I can cut and paste into other sheets.
I run the programs mostly daily and I can get my data from two sources AGL and SA Power Networks.
SA Power Networks supplies a Nem format CSV while AGL supplies its MyUsageData CSV file.
Because I live in SA the AGL file is always a day behind because of the -30 min time difference. Yet they supply SAPN a complete file daily (most times).
If anyone is interested in trying my programs (they are free) please PM me (that's the mail ICON two left from your avatar). So we can directly communicate.
Attached is a PDF which explains in more detail file structures for MyUsageDate and NEM format files etc
Cheers
Neil
If this comment solves your issue please solve the post, if you like this comment please take the opportunity to click the Like button below.
-
- 1
- 2


